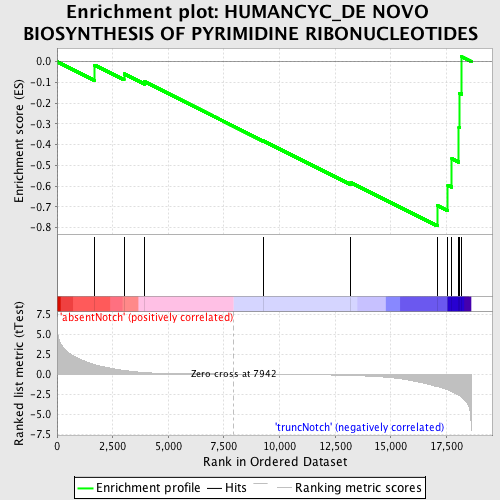
Profile of the Running ES Score & Positions of GeneSet Members on the Rank Ordered List
| Dataset | Set_03_absentNotch_versus_truncNotch.phenotype_absentNotch_versus_truncNotch.cls #absentNotch_versus_truncNotch.phenotype_absentNotch_versus_truncNotch.cls #absentNotch_versus_truncNotch_repos |
| Phenotype | phenotype_absentNotch_versus_truncNotch.cls#absentNotch_versus_truncNotch_repos |
| Upregulated in class | truncNotch |
| GeneSet | HUMANCYC_DE NOVO BIOSYNTHESIS OF PYRIMIDINE RIBONUCLEOTIDES |
| Enrichment Score (ES) | -0.79190856 |
| Normalized Enrichment Score (NES) | -1.4355572 |
| Nominal p-value | 0.047016274 |
| FDR q-value | 0.5654798 |
| FWER p-Value | 1.0 |
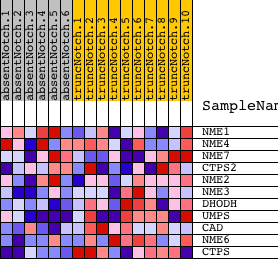
| PROBE | DESCRIPTION (from dataset) | GENE SYMBOL | GENE_TITLE | RANK IN GENE LIST | RANK METRIC SCORE | RUNNING ES | CORE ENRICHMENT | |
|---|---|---|---|---|---|---|---|---|
| 1 | NME1 | 770014 | 1678 | 1.164 | -0.0167 | No | ||
| 2 | NME4 | 3140736 5900446 | 3009 | 0.460 | -0.0592 | No | ||
| 3 | NME7 | 60170 1230551 2850333 4200102 4560411 5090647 | 3932 | 0.191 | -0.0967 | No | ||
| 4 | CTPS2 | 360647 3940110 | 9263 | -0.022 | -0.3818 | No | ||
| 5 | NME2 | 2190672 | 13204 | -0.166 | -0.5831 | No | ||
| 6 | NME3 | 1660440 | 17091 | -1.554 | -0.6938 | Yes | ||
| 7 | DHODH | 3170072 | 17565 | -1.964 | -0.5953 | Yes | ||
| 8 | UMPS | 2340541 4730438 | 17743 | -2.175 | -0.4676 | Yes | ||
| 9 | CAD | 2340717 | 18061 | -2.636 | -0.3182 | Yes | ||
| 10 | NME6 | 510136 6380722 | 18086 | -2.660 | -0.1517 | Yes | ||
| 11 | CTPS | 70451 1740132 | 18187 | -2.854 | 0.0231 | Yes |